A Comparative Overview of Power BI and Qlik Sense
In today’s world, dealing with lots of data is a big task. But special tools can help. They’re like helpers that make data easier to understand. These tools help people see patterns and make better decisions. They can do things like cleaning up data, figuring out trends, and even guessing what might happen next.
Both Power BI and Qlik Sense have risen to the occasion, offering diverse functionalities and features that cater to a wide range of data analysis and visualization needs. In this article, we embark on a comprehensive comparison of these two best BI tools available in the market. By the end, you’ll have a clearer understanding of which tool might best suit your organization’s data journey. Before going into the comparison we will briefly get to know what are these two different tools.
Getting to know Microsoft power BI
Power BI is a smart tool made by Microsoft. It can be conneted to different data sources and get useful information. It’s good for businesses. It helps them create reports and charts. People who don’t know much about data can use Power BI too. It’s like a friendly tool that helps them start working with data. It works well with other Microsoft tools like Excel. People can also make it look and work the way they want. one of the best feature of this tool is its smooth integration with another Microsoft products as well as you can connect more than 350 data sources not only that you would also get a huge customized visualizations, that you can use to generate your reports and dashboards some of the key features of these tools are rich graphical visualization. Additionally you can also create one app in Microsoft Power BI so that you can combine multiple reports and share with your end users.
Discovering QlikSense
Qlik Sense is another helpful tool. It is a cloud-based solution from Qlik. Qlik view was their on-premise solution, now since the world is moving forward and we are working more and more on the cloud, and we want to be platform independent that’s why most of the companies are moving their services on the cloud, so that you can access these services at any point of time from anywhere. Qlik sense is an intelligent data visualization tool which empowers client to import and accumulate data from BI sources. One of the features is that you can use data visualization tools as a software to shape raw data into meaningful information, of course all the BI tools are for this purpose but here you get some additional features that you might like using a hybrid method, the users make connect data stored in large sources with the click view in memory data set, it enables users to conduct business Discovery and visual analysis with the aid of direct discovery. Additionally it’s mobile friendly and permissions and roles are also easy to implement in it.
This was a brief discussion about all two different BI tools, now we are going to compare these two tools for an organization whether an organization should adopt one of the tools or not.
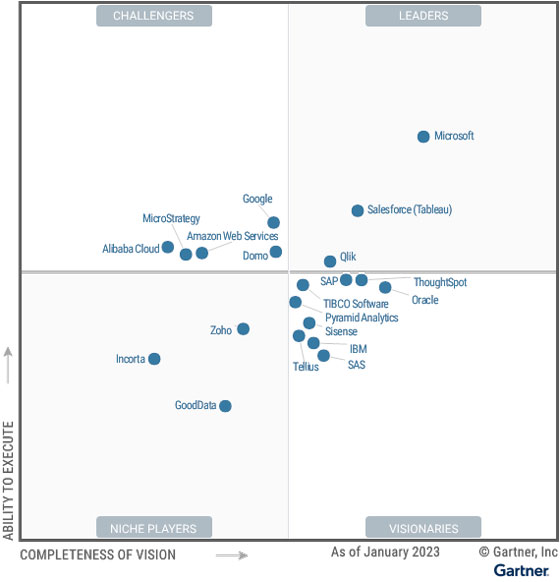
First, we are going to compare these two different tools from the perspective of an organization. So, over here, the very first aspect to consider is the market presence. This is the Magic Quadrant for Analytics and Business Intelligence Platforms for 2023 by Gartner. Gartner consistently presents their Magic Quadrant, where they assess various BI choices worldwide. In this view, you can observe four distinct quadrants. Out of these four quadrants, it’s evident that Microsoft holds the leadership position. On the second spot, we find Tableau, followed by Qlik at number three. These three tools being compared are undoubtedly the best in the market, offering you a choice between any of them. However, given our tendency to lean towards market leaders, it’s clear that Microsoft Power BI holds a distinct advantage. Opting for Qlik wouldn’t be a poor decision either.

For an organization, budget stands as the utmost priority to determine the cost of a BI tool. Following closely is the consideration of performance. Subsequently, other factors enter the equation. It’s crucial to note that this isn’t the ultimate comparison. Your specific requirements play a pivotal role. Are you aiming for advanced analytics, seeking a user-friendly subscription for various reports, or perhaps in need of specific capabilities? Your unique needs will guide your decision.
Microsoft Power BI offers a free entry point through Microsoft Power BI Desktop, allowing you to create diverse dashboards from various data sources. After designing your reports, they can be shared for stakeholder input. A 60-day free trial includes both pro and premium features, enabling advanced analytics, including machine learning. Qlik presents QlikView, Qlik Sense, and Qlik AutoML. QlikView is on-premise, while Qlik Sense and Qlik AutoML are cloud alternatives. Cost considerations are crucial, and detailed licensing prices for these tools are available for your review.
Performance nuances differentiate these tools, each with its distinct advantages. For smaller or medium-scale organizations, Microsoft Power BI may be the optimal choice. In the realm of Advanced analytics, Qlik Sense stands out, offering exceptional visualizations and accommodating diverse datasets. Unlike Qlik, Microsoft Power BI boasts smart recovery, Auto scale capabilities, and fully managed services, ensuring worry-free performance. The performance of Microsoft Power BI Services hinges on the licensing type, with the premium capacity-based license unlocking auto scaling and automated Performance Tuning features.
Selecting the optimal platform for your organization hinges on your unique needs and preferences. To make an informed choice, it’s advised to thoroughly assess both Power BI and Qlik Sense. Take into account essential factors like cost, available features, integration possibilities, and the extent of customization before arriving at a decision.


